By Ray Marx, John P. Porcari, Ph.D., Scott Doberstein, M.S., Richard Mikat, Ph.D., and Carl Foster, Ph.D., with Daniel J. Green
There are a number of reasons for a person to know his or her percent body fat (%BF) and waist-to-hip ratio (WHR). For starters, these are markers of health that clients on weight-loss or behavior-change programs can use to monitor progress when the numbers on the bathroom scale reach a plateau. In addition, body composition is an important component of health-related fitness because of the relationship between excess body fat and chronic disease.
Body composition refers to the proportion of lean tissue (i.e., muscle, connective tissue, bone, blood, nervous tissue, skin and organs) to body-fat tissue. A certain amount of body fat is necessary for overall health and well-being, though too much body fat can be detrimental to health and increases the risk of many diseases, including heart disease, type 2 diabetes, osteoarthritis and stroke. Women with a %BF of 32% or higher, and men with a %BF of 25% or higher, are considered to have obesity.
There are number of ways to measure %BF, ranging from the “gold standard” but very expensive hydrostatic (i.e., underwater) weighing to inexpensive but slightly less accurate skinfold measurements.
Circumference measurements are much simpler to conduct, as they involve using a measuring tape to record an individual’s circumference at predetermined sites on the body.
While WHR is simply a ratio of two measures (i.e., waist circumference divided by hip circumference), it’s important to understand the importance this ratio has in terms of its relationship to an individual’s health. People with higher WHRs (i.e., above 0.86 for females and 0.95 for males) are at a greater risk of developing certain health conditions, including cardiovascular disease and type 2 diabetes.
While circumference measurements are inexpensive, tests to determine body composition can be rather expensive and difficult to conduct and offer varying degrees of accuracy. For this reason, exercise professionals, health coaches, nutritionists and physicians are among the professionals who would benefit from an inexpensive, accurate and simple way of measuring body composition.
That’s where PostureCo’s LeanScreen app comes in. The software company based in Trinity, Fla., has developed an app for a phone or tablet that uses photographs to assess a person’s %BF and WHR, at a cost of $39.99. According to PostureCo’s website (www.postureanalysis.com), the LeanScreen app can use photographs taken from the front and side to predict these measurements within 3% accuracy.
ACE called on John Porcari, Ph.D., and his researchers in the Department of Exercise and Sport Science at the University of Wisconsin–La Crosse to put LeanScreen to the test.
The Study
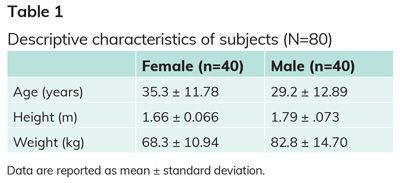
The subjects for this study were 40 male and 40 female volunteers with a diverse range of body types and ages (Table 1). This allowed the research team to determine the accuracy of the LeanScreen app across a wide range of people.
Waist and hip circumference measures were made following accepted protocols, using a tape measure as each subject stood tall with his or her hands at the sides. The waist measurement was made at the narrowest part of the waist, just above the iliac crest, while the hip measurement was made at the widest part of the hips.
The researchers measured %BF using a BOD POD, which measures the amount of air displaced by a person in a known volume of space. While hydrostatic weighing, which uses water displacement rather than air displacement, is considered the gold standard for determining %BF (with a margin of error of only 1.5 to 2.0%), it is rather messy and many people find it to be a pretty unpleasant experience, as it requires the subject to be completely submerged in water after exhaling all available air from the lungs. By contrast, the BOD POD is a relatively easy and comfortable method for measuring %BF (see sidebar, below).
What is the BOD POD?
The BOD POD is an egg-shaped chamber that uses air displacement to determine a person’s body composition. The person sits in the machine and researchers can use the amount of air displaced and the subject’s body weight to calculate %BF. Research has shown the BOD POD to be virtually identical to hydrostatic weighing as a means of measuring %BF (Fields, Hunter and Goran 2000; Vescovi et al., 2000; Nunez et al., 1999; McCrory et al., 1995).
Pictures of each subject were taken using the LeanScreen app on an iPad following the procedures provided by PostureCo. Two photographs were taken from 12 feet away, one from the front and the other from the side. Reference lines were then drawn onto the photos in the software program, again according to the app’s directions. These lines were placed at each side of the neck, halfway between the sternum and umbilicus at the level of the umbilicus, and at each side of the hips at the widest location.
Each subject’s height, weight, age and gender also were entered into the app.
For all measurements, subjects wore tight-fitting clothing (swimsuit or spandex shorts and a sports bra) and a swim cap. Tight clothing allows for more accurate placement of reference points on the LeanScreen app and the swim cap minimized heat lost from the head when using the BOD POD, which allows for more accurate measurements of %BF.
The Results
Percent Body Fat
Overall, %BF as measured by the BOD POD was 21.6 ± 8.77, while the value provided by the LeanScreen app was 20.2 ± 7.74 (Figure 1).
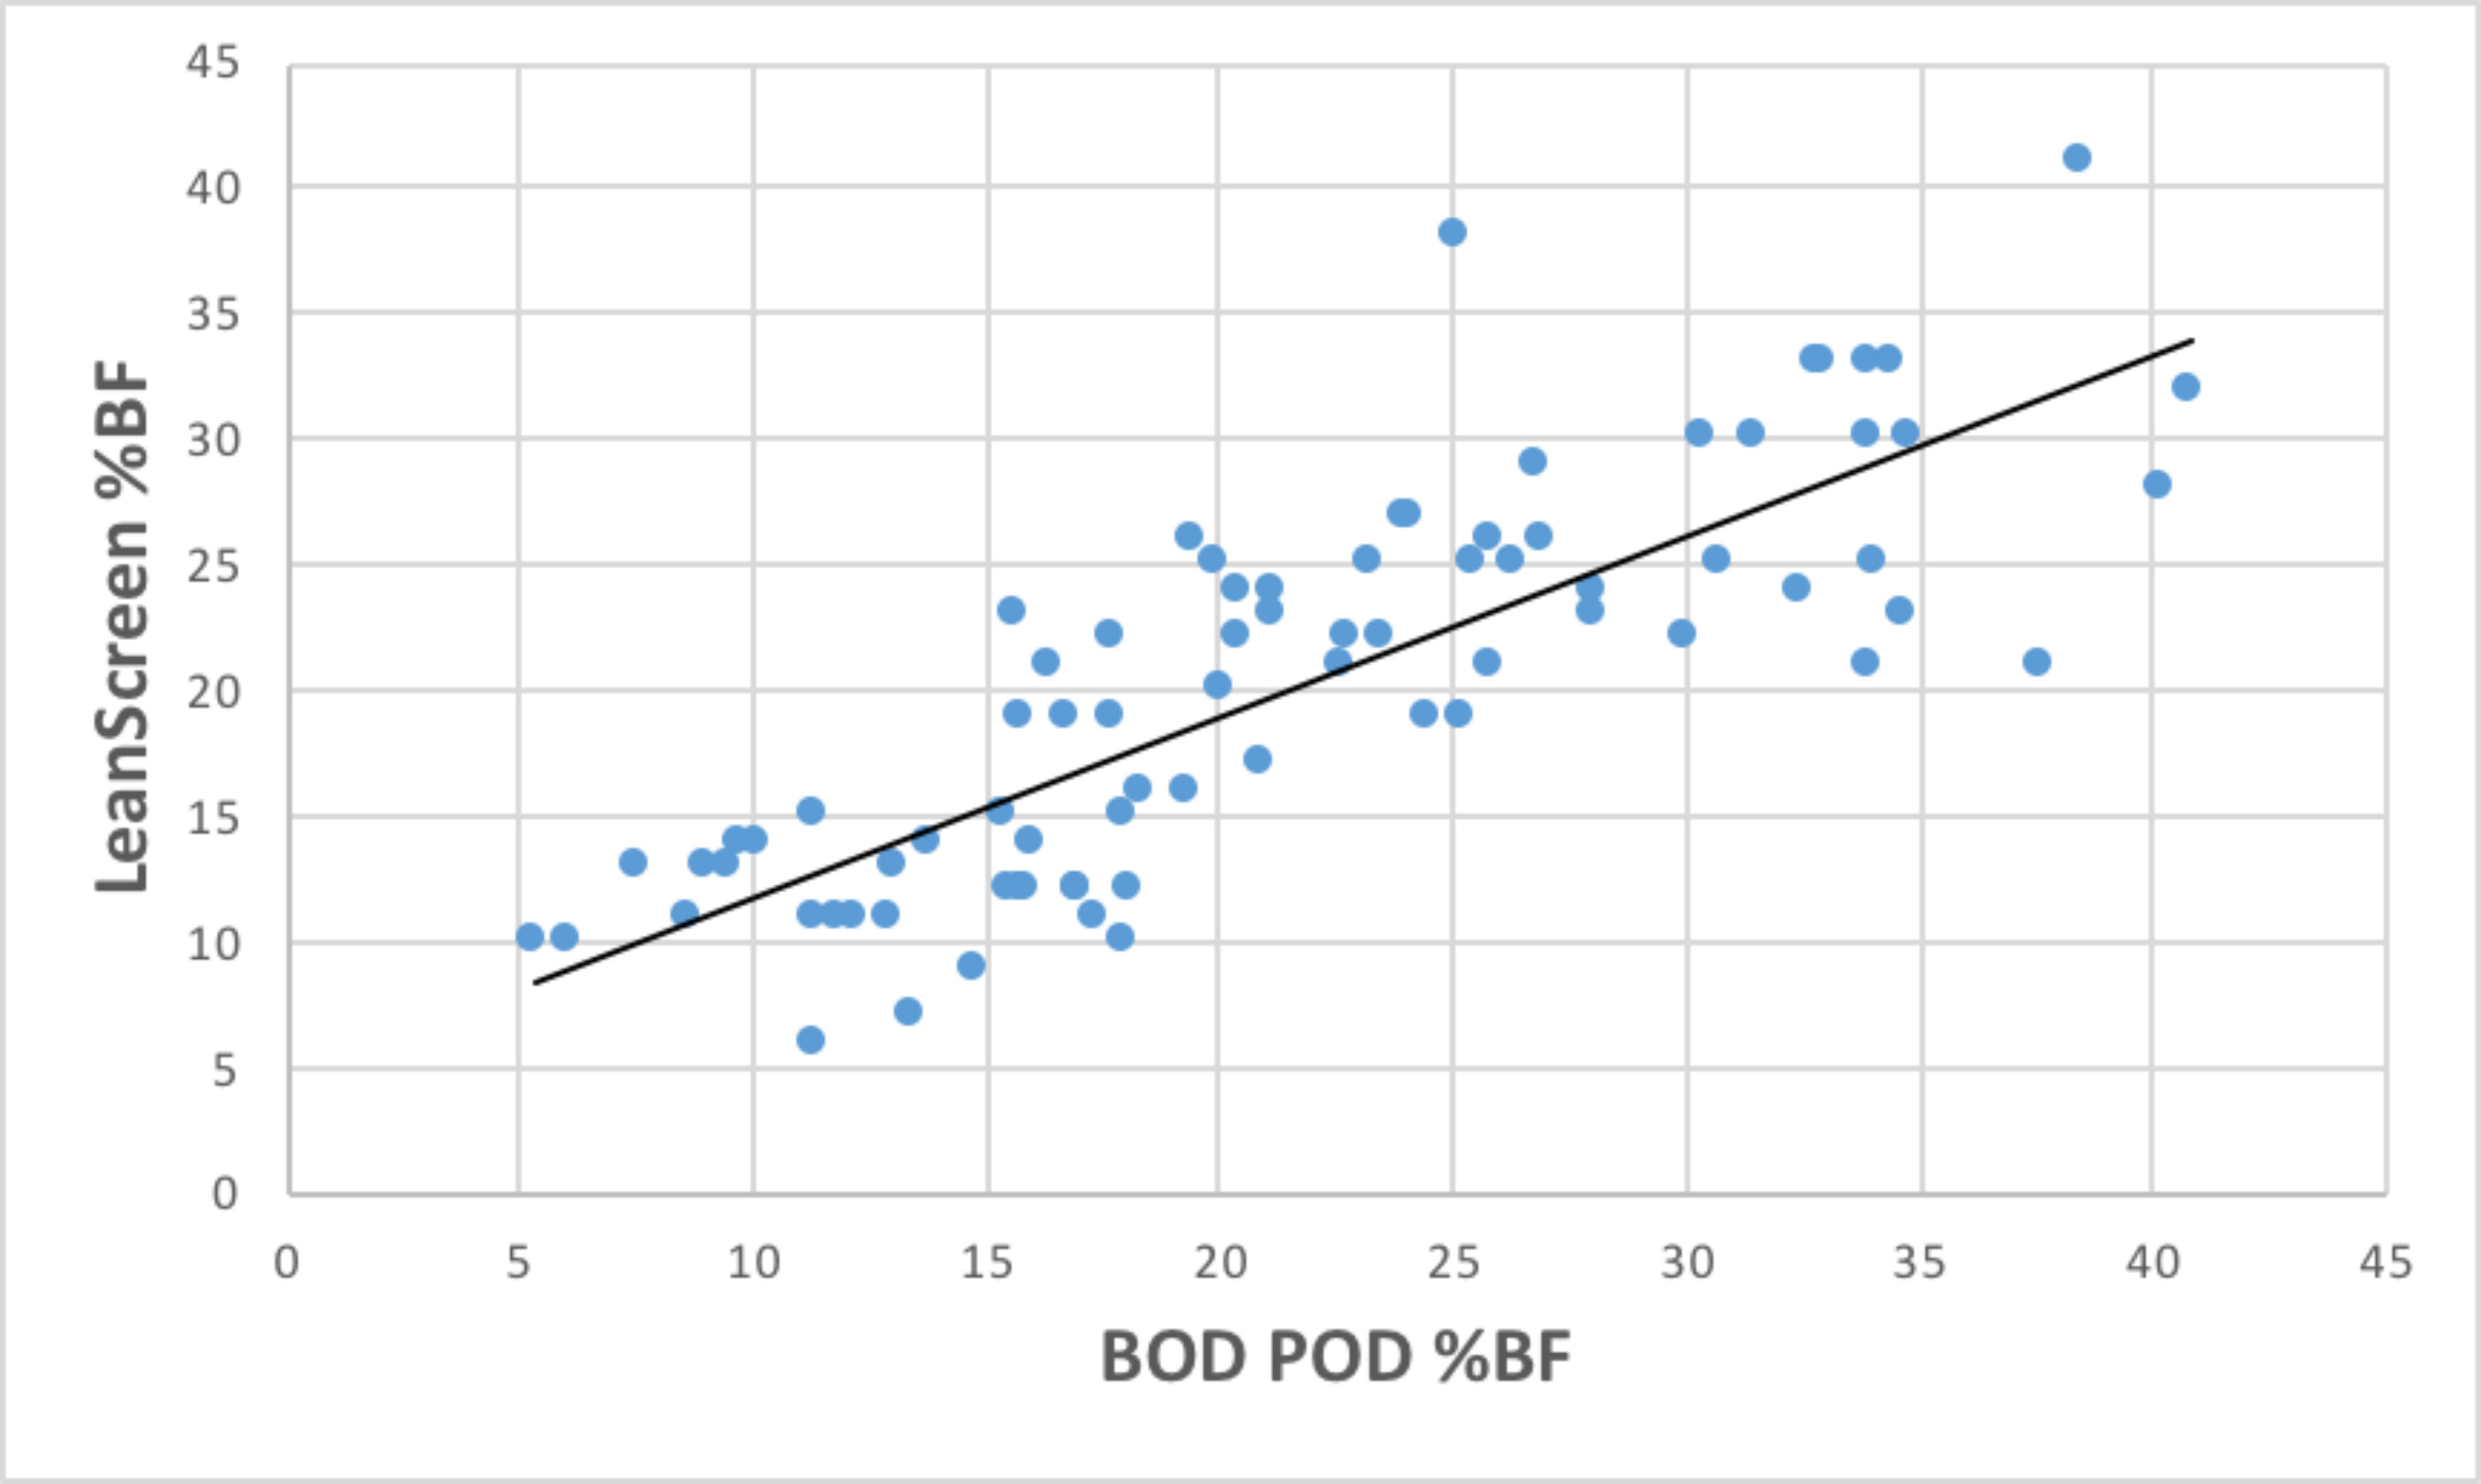
Figure 1. The relationship between percent body fat (%BF) determined by the BOD POD and the LeanScreen app.
A plot of the differences between %BF as determined by the BOD POD and LeanScreen is presented in Figure 2. Upon examination of the calculated differences observed in Figure 2, the researchers noted that people with a lower %BF (<10%) appeared to be overpredicted by the LeanScreen app, while those with a higher %BF (>30%) appeared to be underpredicted by the LeanScreen app.
To investigate this further, the researchers divided the subjects into three groups based on %BF as calculated by the BOD POD: (1) <10%, (2) 10 to 30% and (3) >30%. It was found that for those with a %BF <10%, the LeanScreen app significantly overpredicted by an average of 4% (12.0 ± 1.63 vs. 8.0 ± 1.74). For those with a %BF between 10 and 30%, there was no significant difference between the two measurements (18.5 ± 6.52 vs. 19.3 ± 5.12). For those with a %BF >30%, LeanScreen significantly underpredicted by an average of 5.7% (28.9 ± 5.26 vs. 34.6 ± 3.03).
The LeanScreen app claims to be accurate within 3% of the actual %BF. However, of the 80 subjects in this study, only 35 (44%) had a %BF as predicted by LeanScreen that was within ±3% of the BOD POD values (see Figure 2).
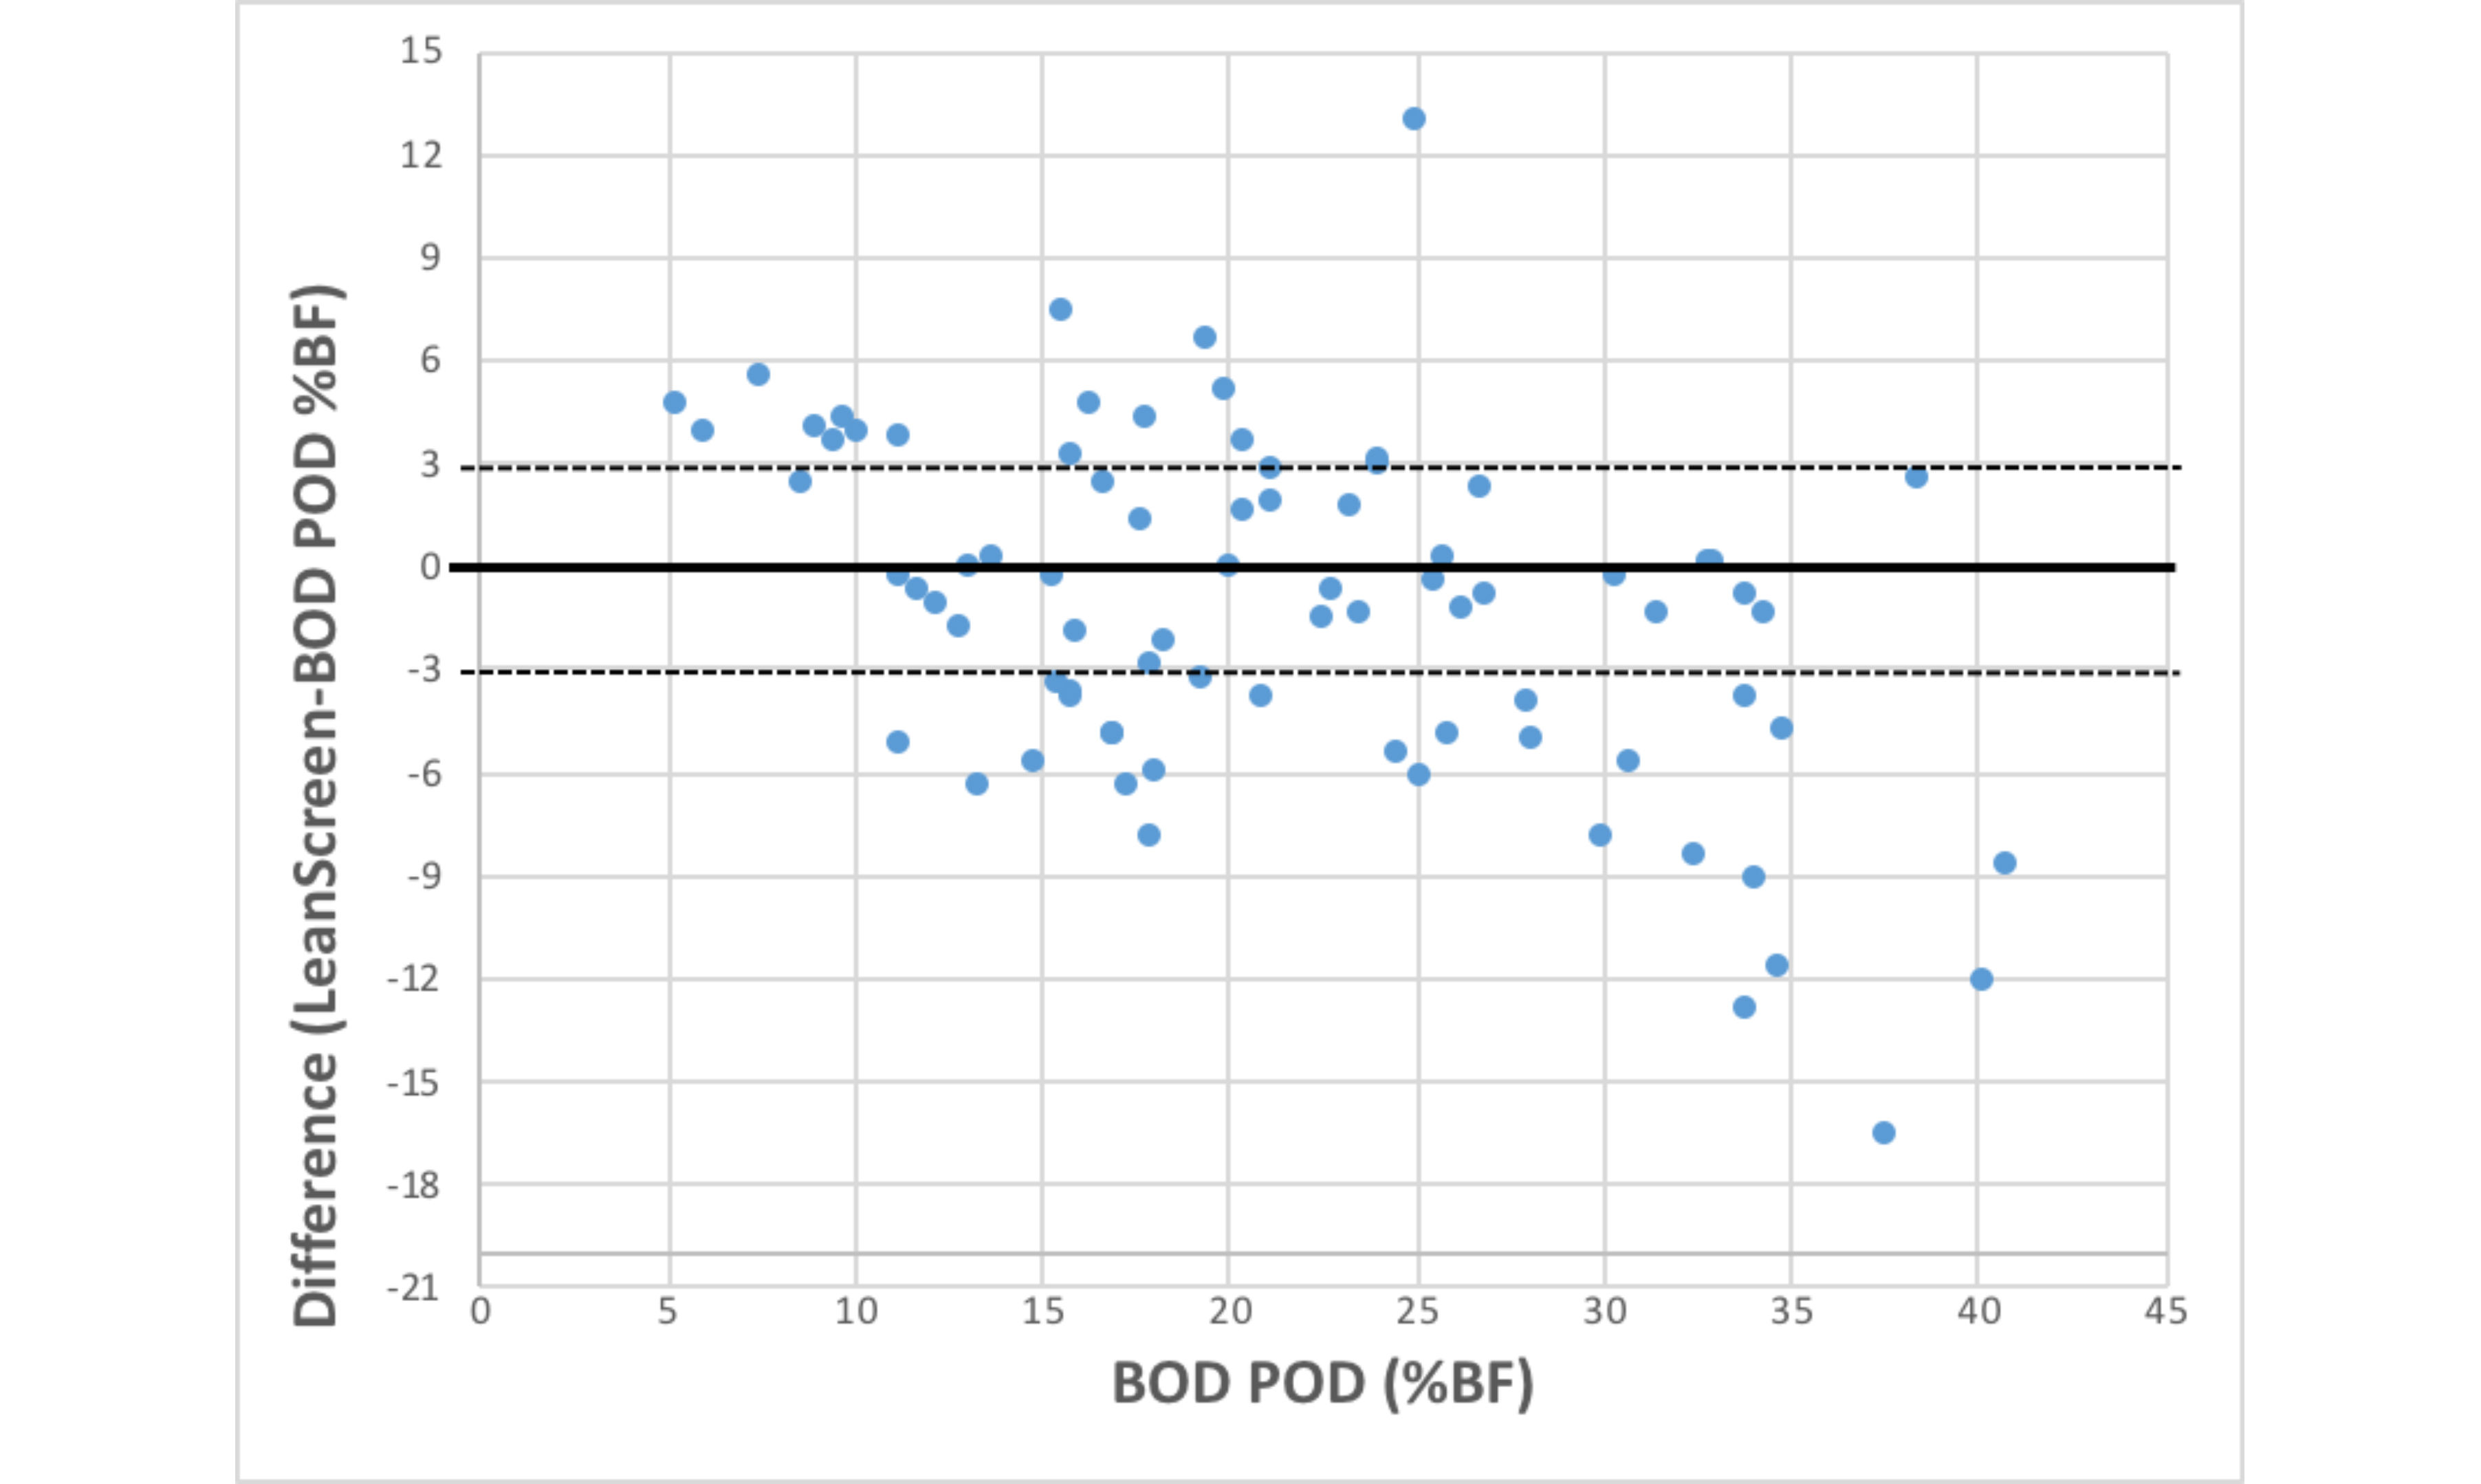
Figure 2. The difference between percent body fat (%BF) determined by the BOD POD and the LeanScreen app. Dotted lines represent ± 3% difference between the LeanScreen app and the BOD POD.
Waist-to-hip Ratio
There was no significant difference in WHR as determined by the LeanScreen app compared to manually measured values. Because the LeanScreen app rounds to only one decimal point when determining WHR, data are shown in straight lines on the vertical (y) axis, whereas manually measured WHR values were reported to two decimal points on the horizontal (x) axis (Figure 3).
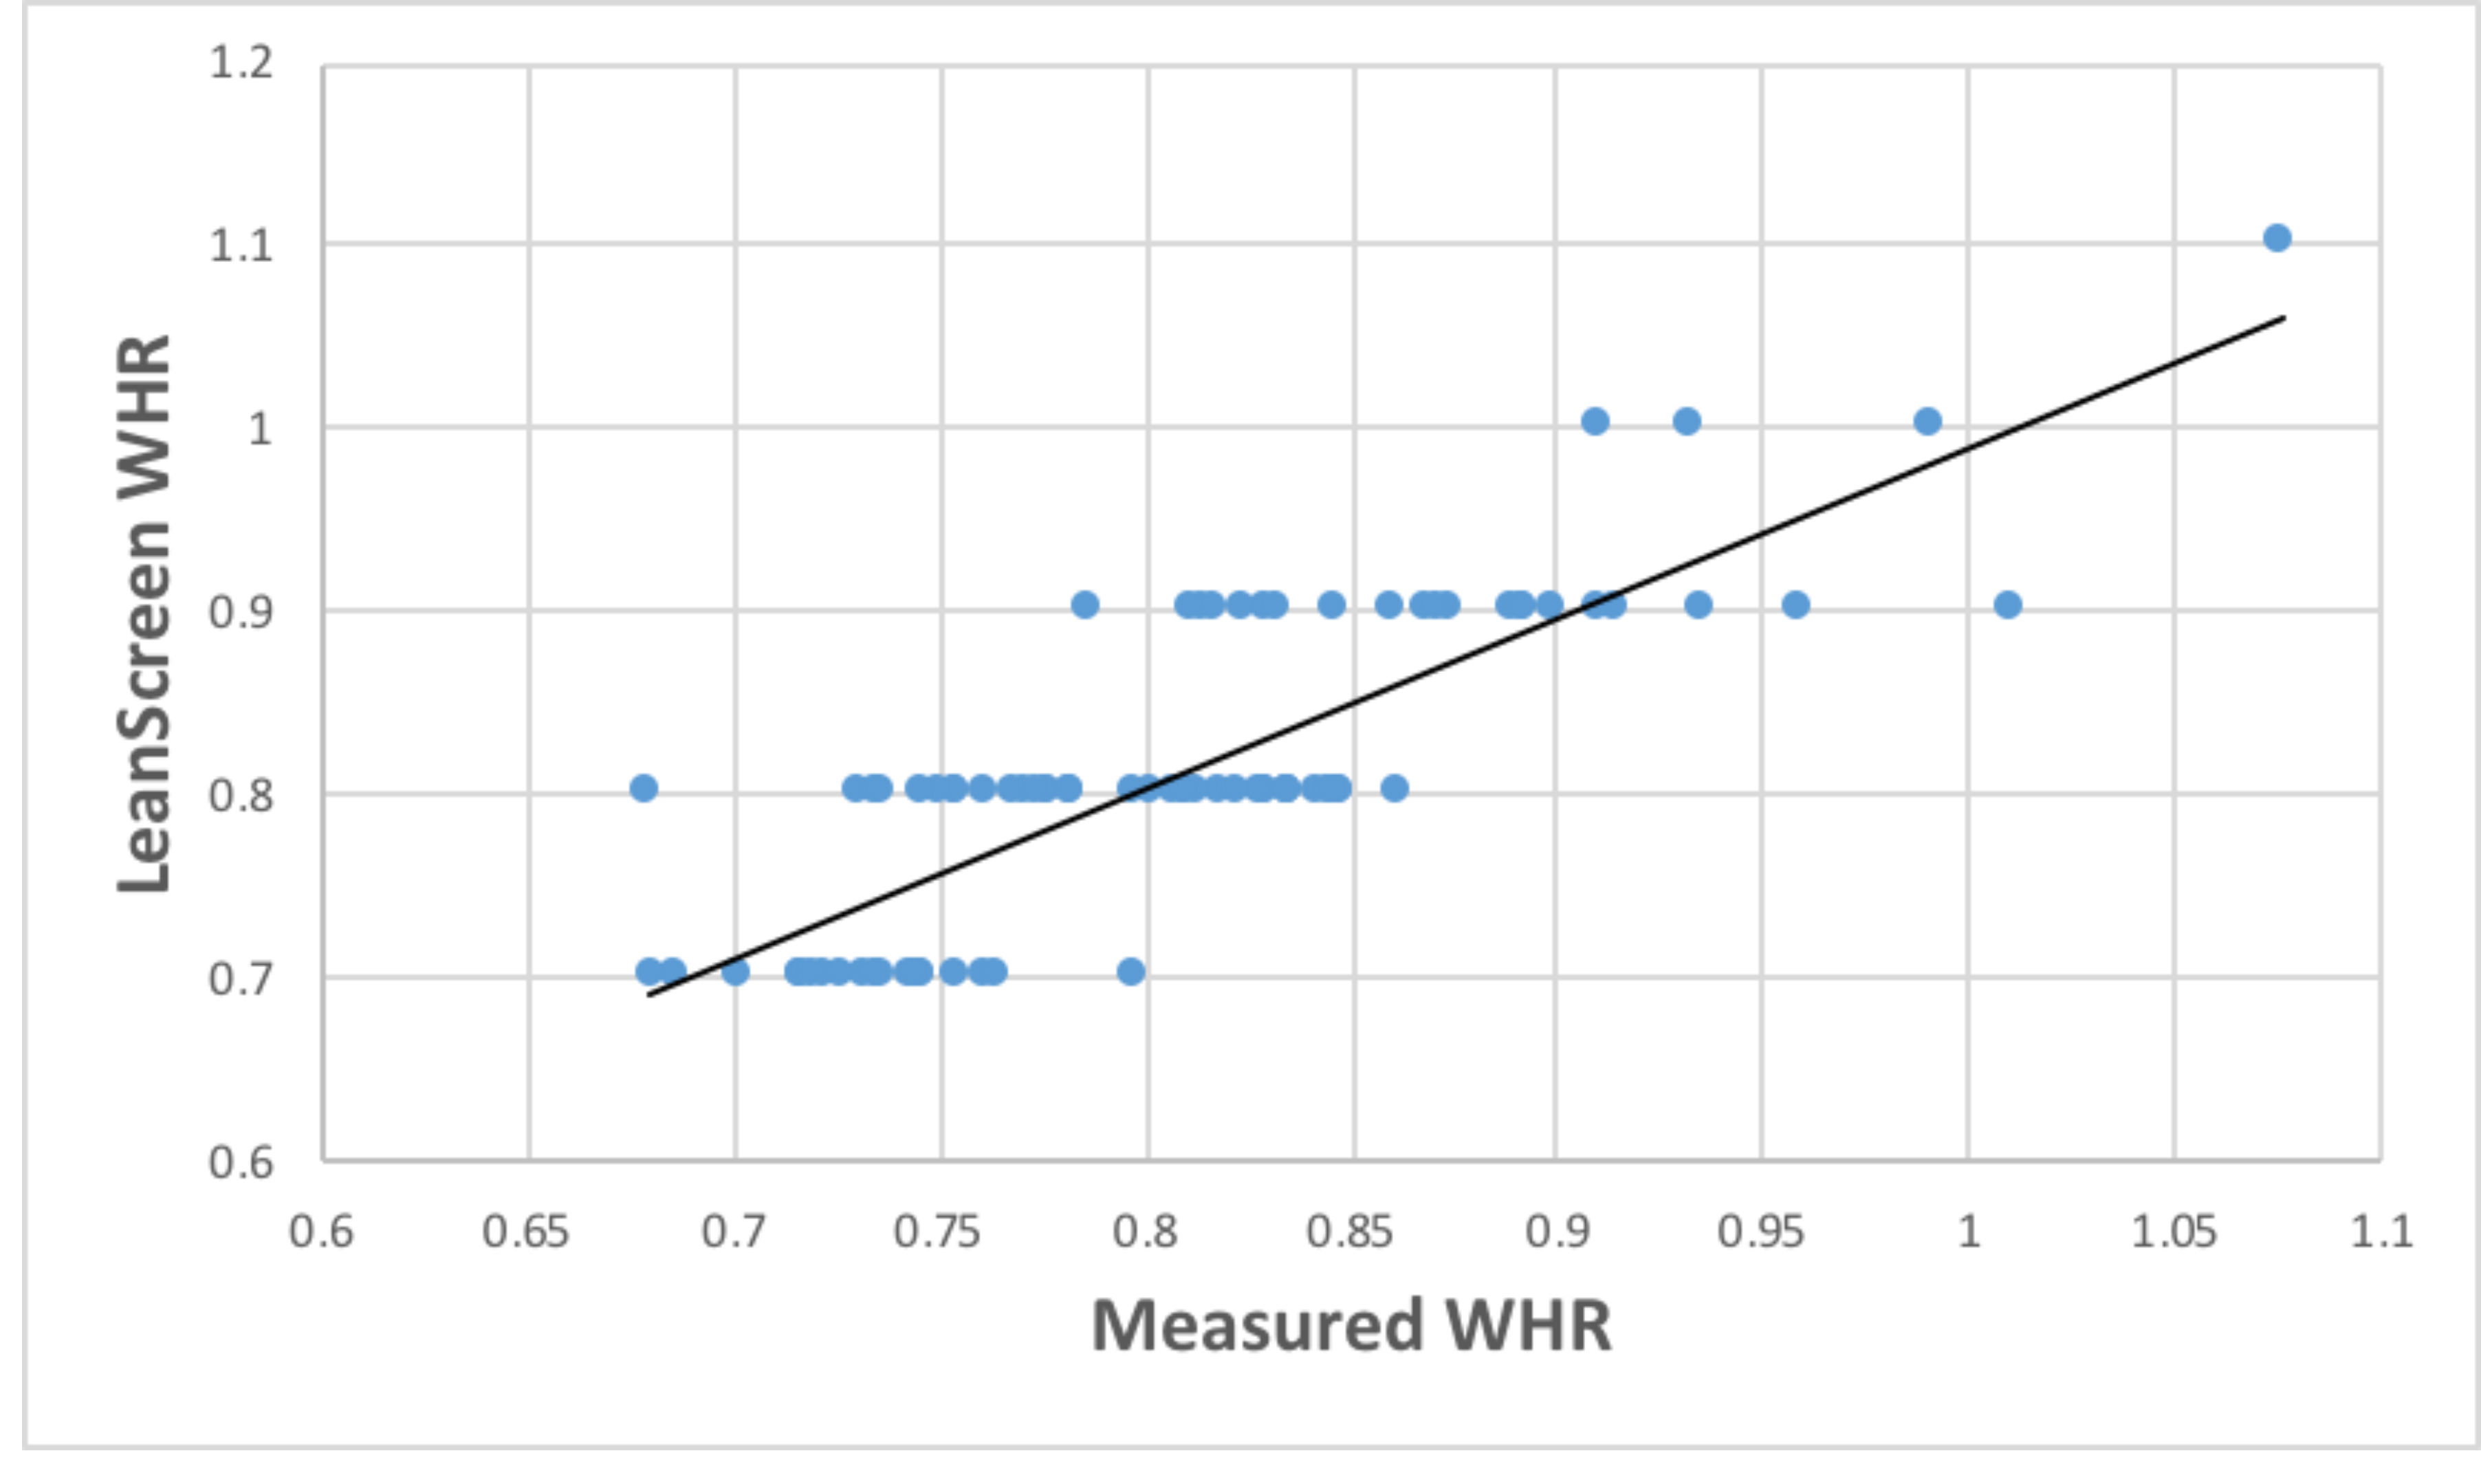
Figure 3. The relationship between manually measured waist-to-hip ratio (WHR) and WHR determined by the LeanScreen app.
Differences between WHR as determined by the LeanScreen app compared to manually measured WHR values are presented in Figure 4. The horizontal lines represent the 95% confidence intervals around the line of identity—73 subjects (91%) fell within this range.
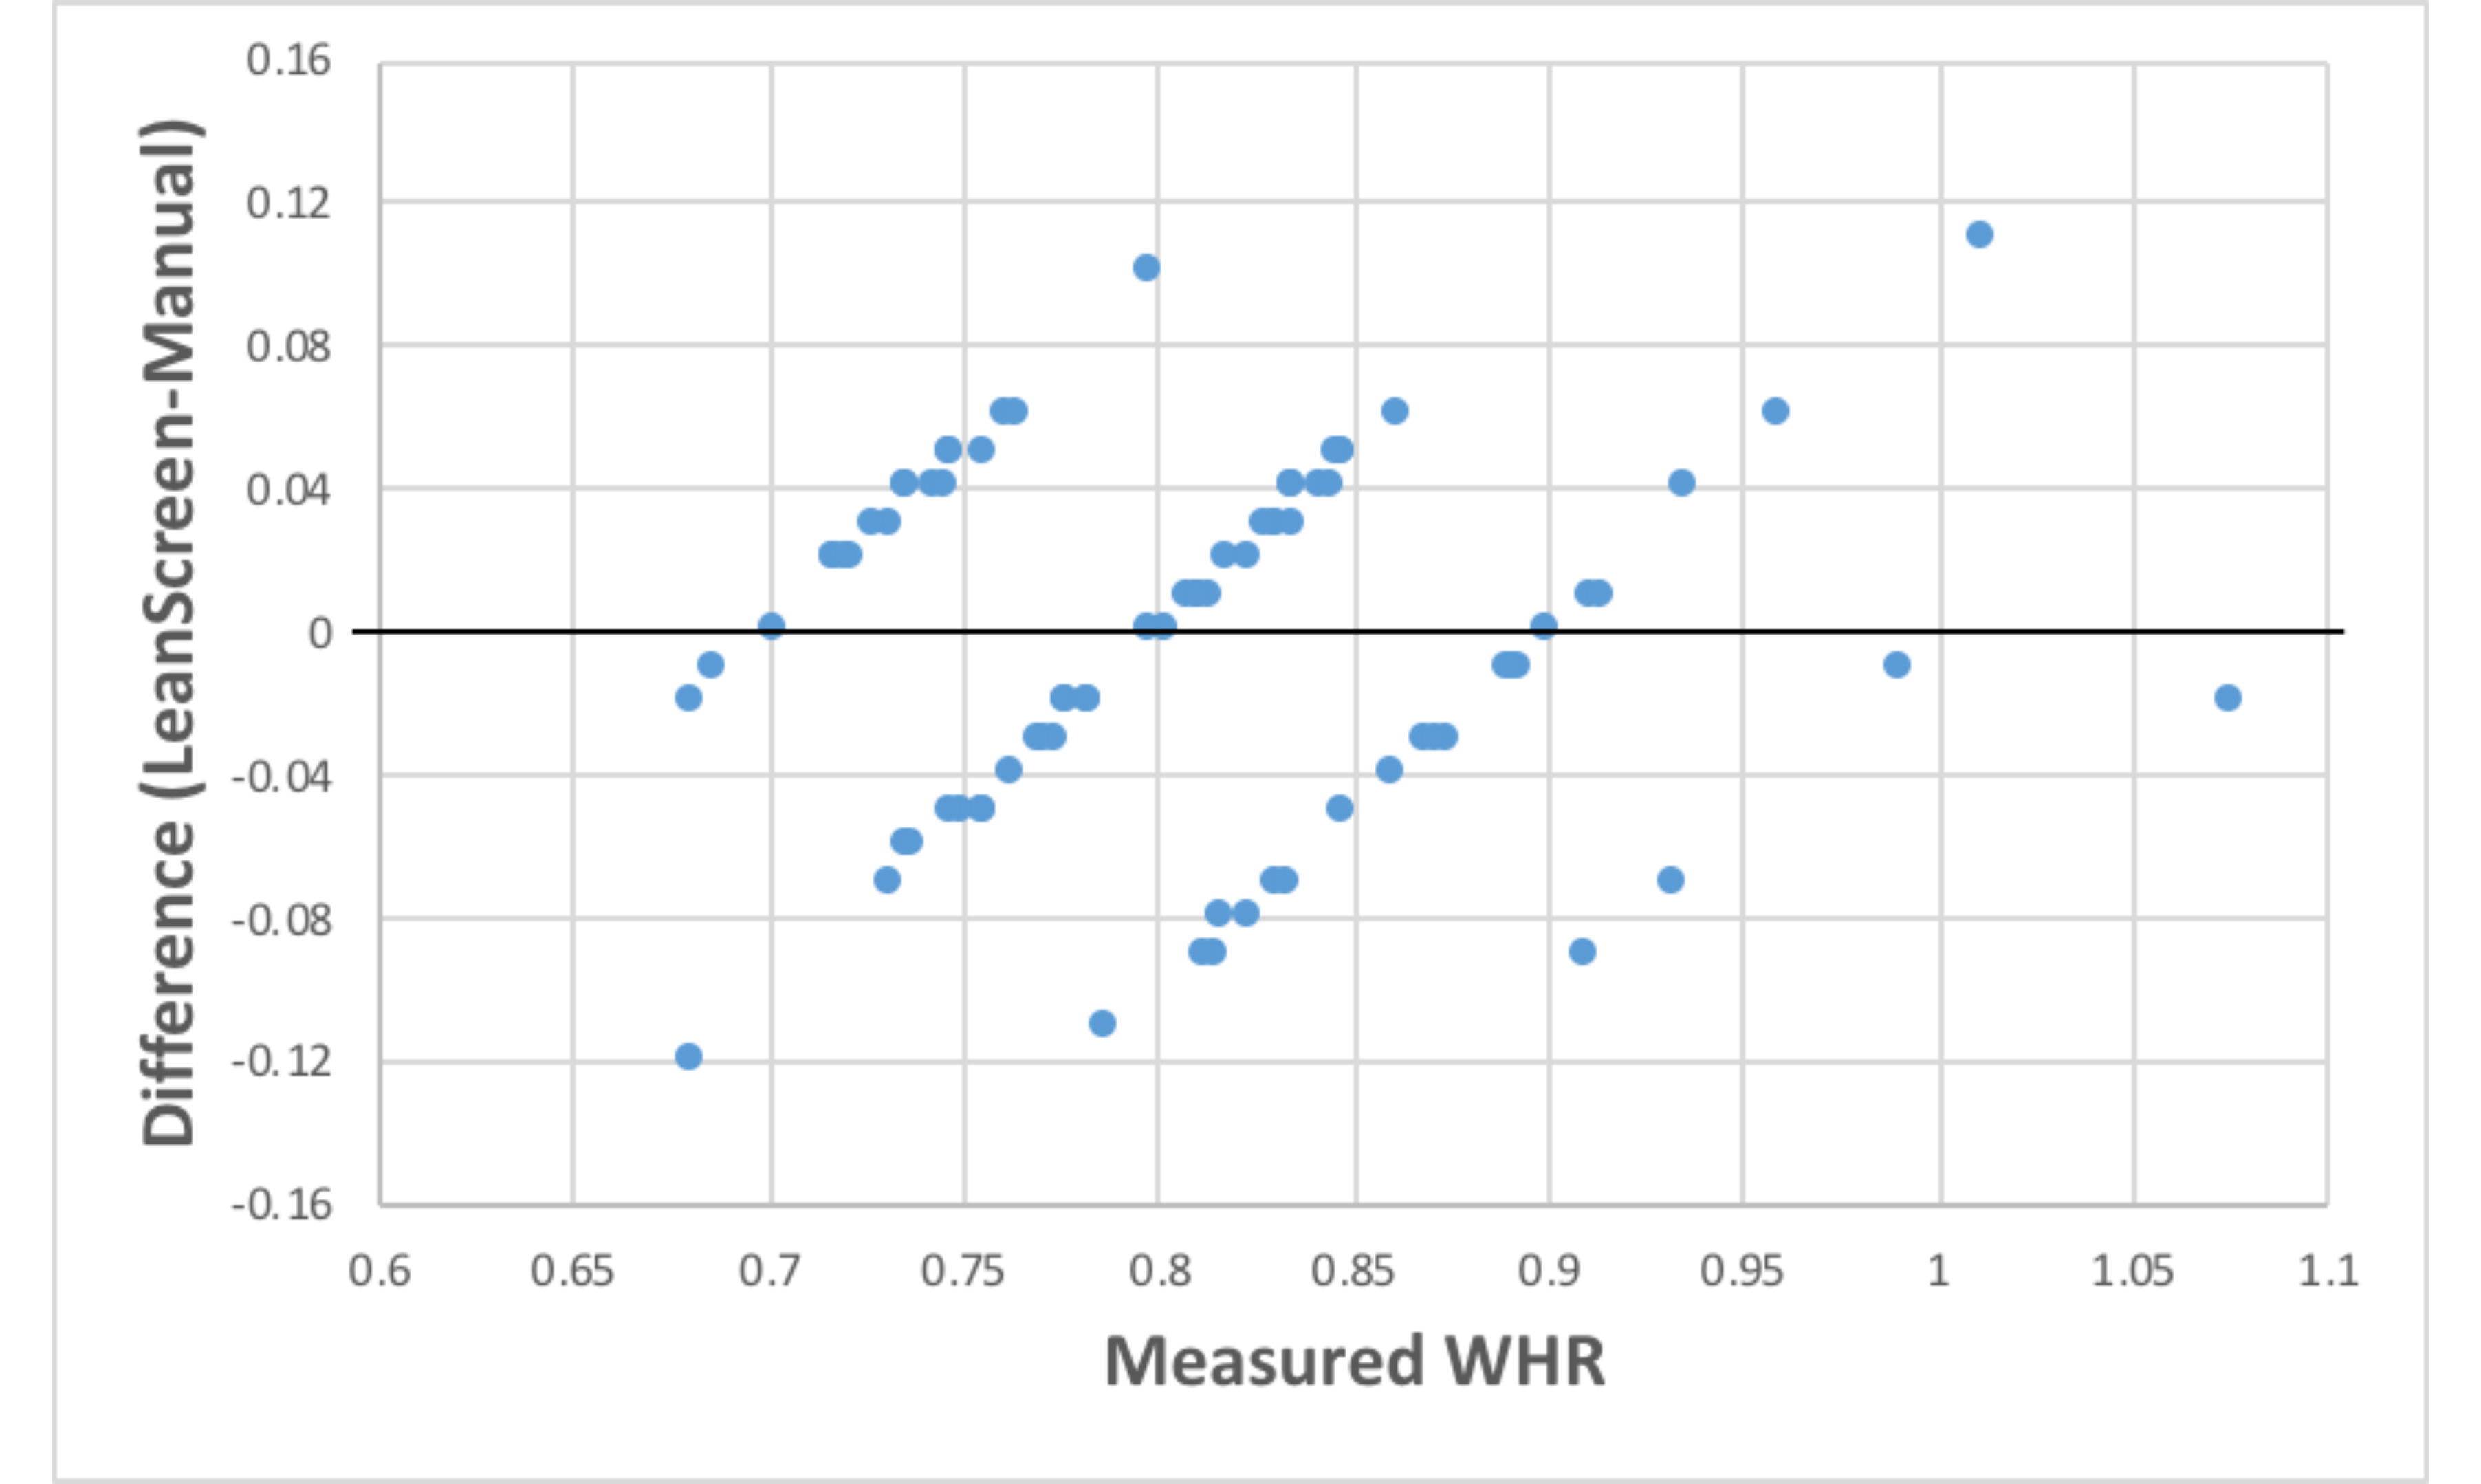
Figure 4. The relationship between measured waist-to-hip ratio (WHR) value and the difference between measured WHR and LeanScreen-predicted WHR. Dotted lines represent the 95% confidence intervals around the line of identity.
The Bottom Line
Percent Body Fat
When it comes to %BF, these study results suggest that although the mean difference between the LeanScreen app and the BOD POD was only 1.4% (20.2% vs. 21.6), this is extremely misleading, according to Dr. Porcari. “There was a wide variation in accuracy depending on the actual body-fat percentage of the individual,” he says.
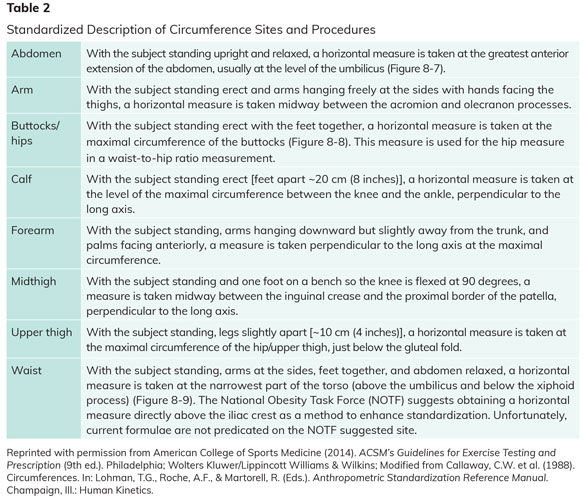
For example, for those with %BF over 30%, the LeanScreen underpredicted by an average of 5.7%. This means that a person whose %BF is actually 30% could be told by LeanScreen that his or her %BF is about 36%, which carries with it considerably worse health risks and important considerations. In fact, a woman with a %BF of 30% is considered “average,” while a woman with a %BF of 36% is well above the threshold where she is considered to have obesity (i.e., 32%) (Table 2). It is also important to highlight the fact that only 44% of study participants fell within ±3% window promised by the maker of LeanScreen.
In terms of LeanScreen’s ability to predict %BF, the variability found in this study is higher than that found in research on other methods of measuring %BF, including skinfold measurements, dual-energy X-ray absorptiometry (DEXA), the three-compartment model and bioelectrical impedance analysis (BIA).
According to Dr. Porcari, “It’s really difficult to predict body-fat percentage, particularly when the cost of the method is a consideration.”
Waist-to-Hip Ratio
No significant difference was found between manually measured WHR values and those reported by the LeanScreen App, with 73 of 80 subjects (91%) having values that were within the 95% confidence intervals of manual measurements.
One potential problem with the app is that the software only rounds to the nearest one decimal point (e.g., 0.8 or 0.9), while most guidelines for WHR are carried to two decimal points. For example, guidelines state that a WHR above 0.95 for men and 0.86 for women correlates to a higher risk of chronic disease (Bray and Gray, 1988). Because LeanScreen only rounds to one decimal point, some people may be misclassified due to a rounding error.
Finally, while the app does a good job of predicting WHR, the process of measuring this manually is relatively inexpensive and simple, again making the time and money involved with using the app not worthwhile.
This ACE-sponsored study was first published in the peer-reviewed
International Journal of Research in Exercise Physiology.
References
Bray, G.A. and Gray, D.S. (1988). Obesity: Part I: Pathogenesis. Western Journal of Medicine, 149, 429–441.
Fields, D., Hunter, G. and Goran, M. (2000). Validation of the BOD POD with hydrostatic weighing: Influence of body clothing. International Journal of Obesity and Related Metabolic Disorders, 24, 2, 200–205.
McCrory, M. et al. (1995). Evaluation of a new air displacement plethysmograph for measuring human body composition. Medicine and Science in Sports and Exercise, 27, 12, 1686–1691.
Nunez, C. et al. (1999). Body composition in children and adults by air displacement plethysmography. European Journal of Clinical Nutrition, 53, 382–387.
Vescovi, J. et al. (2001). Evaluation of the BOD POD for estimating percentage body fat in a heterogeneous group of adult humans. European Journal of Applied Physiology, 85, 326–332. DOI: 10.1007/s004210100459



 by
by 